Same revenue.A quarter less spend.
Mebeli Largo sells thousands of furniture SKUs online and through its large showroom in Bulgaria. The Google Ads account was buying volume, with every room category funded at much the same rate regardless of return. BYLT rebuilt it to buy margin instead: ranking the catalogue by profit contribution and funding the winners harder. Over March to May 2026 versus the previous period, ROAS rose 31.6% to 9.14 while ad spend fell 24.5%.


31.6% Higher ROAS for Mebeli Largo on a Quarter Less Spend
A Google Ads programme for Mebeli Largo (Мебели Ларго), a Bulgarian furniture retailer selling thousands of SKUs online and through its large showroom. Rather than funding every room category at the same flat rate, BYLT ranked the range by margin, cut the weakest categories hardest and held funding on the best-performing engines. Over March to May 2026 versus the previous period, ROAS rose from 6.94 to 9.14 while ad spend fell 24.5%, and conversion value held virtually flat.
What was in the way.
Mebeli Largo runs Google Ads across thousands of furniture SKUs, sold online and through its large showroom. The catalogue was too big to fund evenly: every room category was funded at much the same rate regardless of return, so budget followed traffic rather than profit, and spend was paced flat through the year.
- Thousands of SKUs, with every room category funded at much the same rate regardless of return.
- Budget followed traffic, not profit: the weakest categories absorbed as much as the best.
- Spend was paced flat, so the spring buying window was funded like any quiet week.
How it got done.
Rank the Range by Margin, Not Volume
The approachSplit the product range into margin tiers and mapped every campaign to the tier it served.
Fund the Winners, Starve the Rest
The solutionCut the low-margin room categories hardest and held funding on the engines that were already earning their place.
Numbers that held up.
ROAS up 31.6% and ad spend down 24.5%, with conversion value held virtually flat.
Over March to May 2026 versus the previous period, ROAS rose from 6.94 to 9.14, up 31.6% on the same catalogue, while ad spend fell 24.5%, from €90,964 to €68,718. Conversion value held virtually flat, down just 0.6% on a quarter less budget, and average order value rose 48.6% as the account traded volume for value. In-store sales rose 23% over the same period.
- ROAS rose from 6.94 to 9.14, up 31.6% on the same catalogue
- Ad spend cut 24.5%, from €90,964 to €68,718
- Conversion value held virtually flat, down just 0.6% on a quarter less budget
- Average order value up 48.6% as the account traded volume for value
The engines that earned more funding.
Funding held on the channels already producing the best return, so the same budget cut bought a stronger ROAS on the accounts that mattered most.
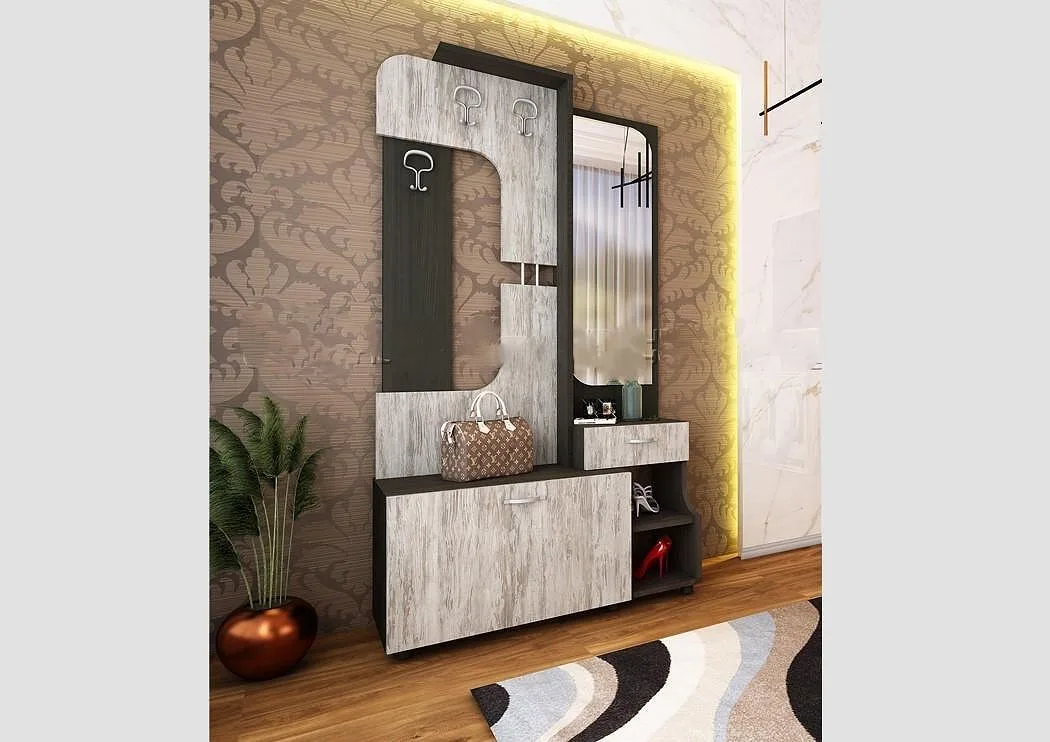
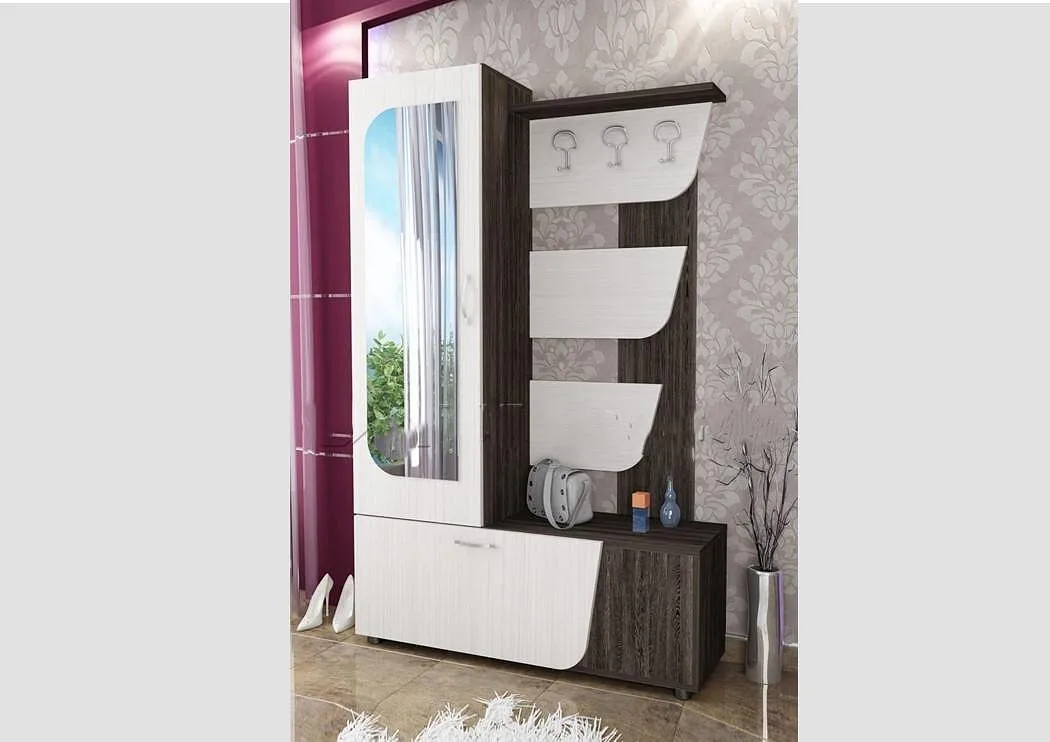
Real SKUs from the live catalogue

Ready for results like these?
Tell us where you want to grow. We'll send back a no-fluff audit and the first three moves we'd make.
Get your free audit